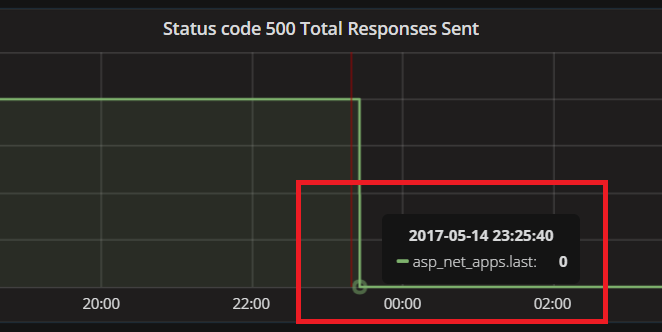
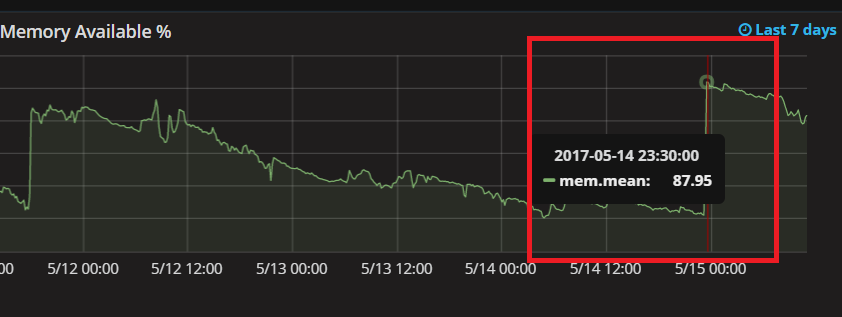
I have a few VMs on Windows Azure that run our ecommerce website, and lately we started using Telegraf, InfluxDb and Grafana to keep an eye on these machines. After a couple weeks of gathering data, I have noticed a weird pattern related to the Memory Available metric:
Everyday almost always at the same period of the day, I have noticed that there is an abrupt amount of memory being freed up which, due to my very very very limited DevOp skills, I cannot figure out what is causing this.
Here's a chart that shows this pattern:
My question is: What could lead to something like this? I feel tempted to suspect that a Memory Leak is to blame but...Free memory never drops below 70% and only happens in two of the VMs with the most traffic!
Should I be concerned when I see something like this?
P.S.: I have stared gathering metrics for Private e Virtual bytes for each of the windows services we have running and for the w3wp process...although I have read that this metrics are not very reliable to find out if you have a memory leak, but at least I'll try to get some sort of trend and see if it correlates with the pattern shown above.


