8

We are building a (Zabbix-based) monitoring system for our applications; hovewer, I'm having difficulties in defining what to monitor?

I have so far come up with the following general categories:

  • hardware data: cpu, ram, swap, etc.
  • middleware data: perfomance/health for MySQL instantces, Tomcat instances, JVMs, etc.
  • logical or application data: the current status/health of the system, e.g. number of active users, page request, etc.
  • kpi data: data for business, e.g. user registration over time.
  • dashboard: quick overview of the system (e.g. microservices are running or not).

Are there any other fundamental categories for to monitor? Or is there another category system to use?

UPDATE: the purpose of the monitoring is

  • the see if the system functions correctly (at high-level, e.g. no services are down, etc. - much like a smoke-test)
  • see, if there are any indicators, that the system is likely to crash (e.g. historical data predicts that we will run out of disk space)
  • if any of these occur, send a warning to the appropriate staff (e.g. via e-mail)

UPDATE: the complexity of our system does not demand an extra application for reporting (e.g. monitoring KPIs); also, we are running in local/local cloud infrastructure, so the cost of the application is not (that)relevant - but it might be someday :-)
3
  • What's the purpose of this monitoring activity? Generating reports? Live status/dashboards? SLAs? Triggering automated actions? Any specs/requirements? Monitoring for the sake of monitoring or to check a box is IMHO not very productive (but granted sometimes it makes management happy). Commented Jul 12, 2017 at 3:19
  • What kind of system is it? One big application? Hundreds of microservices? You'll want to monitor drastically different things.
    – Helmar
    Commented Jul 19, 2017 at 13:30
  • The system consits of several microservices
    – krisy
    Commented Jul 19, 2017 at 15:31

4 Answers 4

5

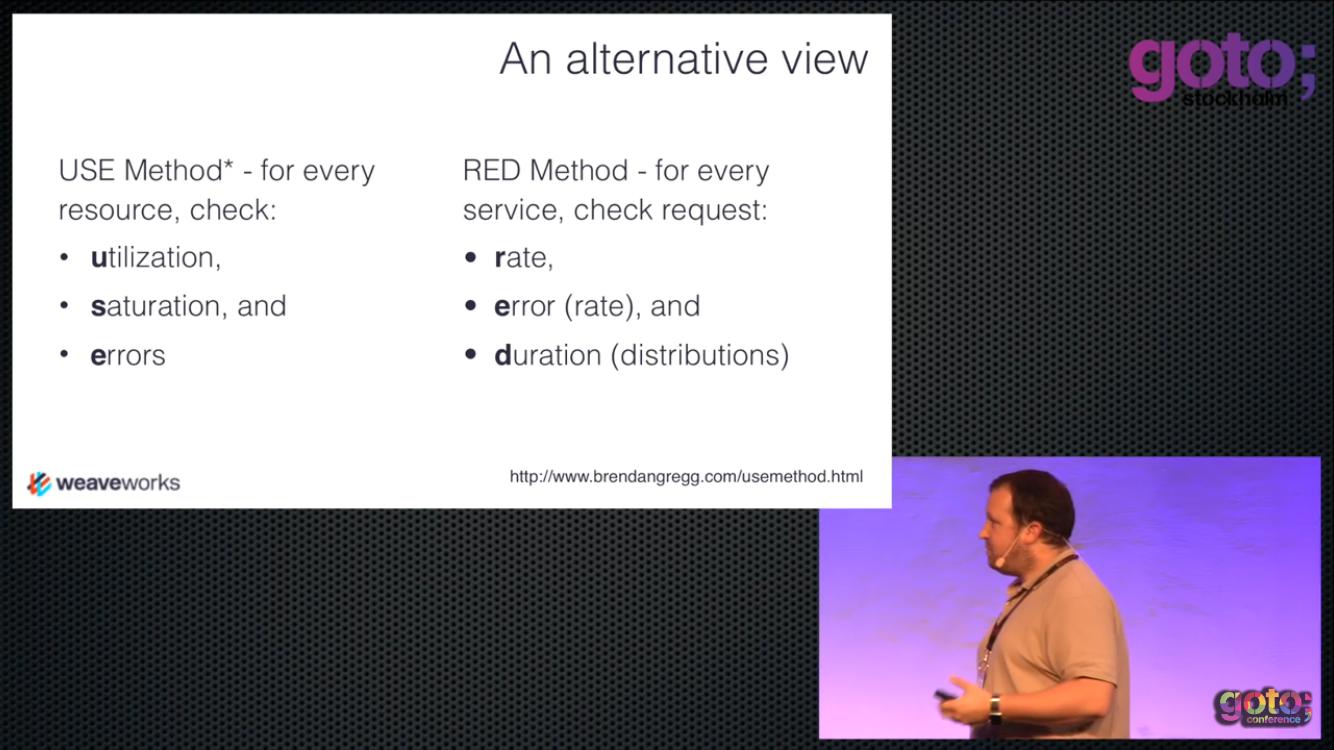
I like this video: GOTO 2016 • Monitoring Microservices • Tom Wilkie

enter image description here

One of the key ideas (for me at least) is to realize the difference between host monitoring and application monitoring. Basically host monitoring tells you that something is fatally wrong now, but application monitoring should be able to predict problems by detecting higher error rate or that requests are taking longer time so you can fix problems before your users notice them.

(I'm not affiliated with weaveworks or the goto conference in any way, I just like the content and think there are some interesting ideas. Use the downvote button to let me know that this answer is not good :) )

2
  • No worries, the video link alone wouldn't be enough but as you summarize (at least) an idea from it verbatim with your own words all is ok.
    – Tensibai
    Commented Jul 18, 2017 at 7:24
  • Great ideas, thank you! I have found under the related videos another useful one: youtu.be/qeVhFyqDbJs?t=354 The main idea is that monitoring items can be separeted into 3*3 different categories (area - infrastructure, application, business; concern - health, performance, capacity; and interaction - passive, proactive, reactiv) - and any combination of these categories is viable (e.g. "how much CPU do I have left?" -> infrastructure, capacity, passive)
    – krisy
    Commented Jul 20, 2017 at 15:37
3

I'm surprised nobody mentioned the four golden signals explicitly as an answer, so I'll add it. Lifted directly from Google's SRE Book chapter on monitoring distributed systems, it is suggested to at least collect metrics on the "Four Golden Signals":

  1. Latency:
    The time it takes to service a request. It’s important to distinguish between the latency of successful requests and the latency of failed requests. For example, an HTTP 500 error triggered due to loss of connection to a database or other critical backend might be served very quickly; however, as an HTTP 500 error indicates a failed request, factoring 500s into your overall latency might result in misleading calculations. On the other hand, a slow error is even worse than a fast error! Therefore, it’s important to track error latency, as opposed to just filtering out errors.
  2. Traffic:
    A measure of how much demand is being placed on your system, measured in a high-level system-specific metric. For a web service, this measurement is usually HTTP requests per second, perhaps broken out by the nature of the requests (e.g., static versus dynamic content). For an audio streaming system, this measurement might focus on network I/O rate or concurrent sessions. For a key-value storage system, this measurement might be transactions and retrievals per second.
  3. Errors:
    The rate of requests that fail, either explicitly (e.g., HTTP 500s), implicitly (for example, an HTTP 200 success response, but coupled with the wrong content), or by policy (for example, "If you committed to one-second response times, any request over one second is an error"). Where protocol response codes are insufficient to express all failure conditions, secondary (internal) protocols may be necessary to track partial failure modes. Monitoring these cases can be drastically different: catching HTTP 500s at your load balancer can do a decent job of catching all completely failed requests, while only end-to-end system tests can detect that you’re serving the wrong content.
  4. Saturation:
    How "full" your service is. A measure of your system fraction, emphasizing the resources that are most constrained (e.g., in a memory-constrained system, show memory; in an I/O-constrained system, show I/O). Note that many systems degrade in performance before they achieve 100% utilization, so having a utilization target is essential. In complex systems, saturation can be supplemented with higher-level load measurement: can your service properly handle double the traffic, handle only 10% more traffic, or handle even less traffic than it currently receives? For very simple services that have no parameters that alter the complexity of the request (e.g., "Give me a nonce" or "I need a globally unique monotonic integer") that rarely change configuration, a static value from a load test might be adequate. As discussed in the previous paragraph, however, most services need to use indirect signals like CPU utilization or network bandwidth that have a known upper bound. Latency increases are often a leading indicator of saturation. Measuring your 99th percentile response time over some small window (e.g., one minute) can give a very early signal of saturation. Finally, saturation is also concerned with predictions of impending saturation, such as "It looks like your database will fill its hard drive in 4 hours."

If you measure all four golden signals and page a human when one signal is problematic (or, in the case of saturation, nearly problematic), your service will be at least decently covered by monitoring.

2

It depends a lot on what your infrastructure situation is. If you're doing auto-scaling, the health of individual instances is mostly irrelevant. The important metrics are total cost, and cost per unit of work (e.g. per request). Personally I don't like to monitor individual instance state if I can possibly avoid it - I try to focus more on broader service-level and application-level metrics:

  • Overall per-service uptime (% of the time that at least one instance is healthy and able to respond to new requests immediately)
  • Overall end-user uptime (% of the time that the user perceives the product as being available - if some core service goes down, this might be user-facing downtime, but a lesser-used service or background worker might not be)
  • 95th percentile response time of each service
  • Message queue length and net queue growth per queue
  • Consumer count per queue
  • Average time to completion per queue (not just time in queue, but time from being queued to completed work for the message)
  • Error rate for each service
  • Cost per unit of work for each service
  • For each server role, what is the ratio of the average CPU utilization to average memory utilization? This is useful for determining if we're scaling poorly - if CPU use is 70% but memory is 20%, we're giving instances too much memory, and vice-versa.
  • Same for peak CPU/memory utilization
  • Time to delivery for deployments

Some of your listed metrics like user registration over time, to me, don't belong in an infrastructure monitoring system like Zabbix. What is anyone watching Zabbing going to do about a 10% drop in registrations? Nothing. This is business reporting data that should be exposed to whoever wants it via a reporting DB, possibly rendered in a nice dashboard because pointy-haired bosses love dashboards.

5
  • While these are good metrics to watch, most of these aren't monitoring. These represent reporting and business intelligence - data that can (often) be aggregated, culled and processed from your monitoring system. Commented Jul 11, 2017 at 19:26
  • This may not fit your personal definition of monitoring, but it's definitely monitoring, and it's the level of data that's important for managing infrastructure and services in an auto-scaling environment.
    – Adrian
    Commented Jul 11, 2017 at 19:30
  • It's not my personal definition and monitoring isn't the same as reporting. Monitoring generates alerts in response to raw data. Reporting aggregates that raw data to generate things like SLA metrics, Utilization reports and so forth. For example, N-able defines it this way and sells (or sold - at least before it was bought by SolarWinds) two separate products: N-able for monitoring and N-Compass for reporting Commented Jul 11, 2017 at 19:40
  • That's one definition of monitoring, but certainly not the only one, and whether or not you came up with it yourself, it's the definition you've personally adopted. Just using higher-level aggregates doesn't make it not monitoring. I didn't suggest that you shouldn't be triggering alerts based on thresholds for any of the metrics I listed; by the definition you linked, triggering alerts is the defining quality of monitoring.
    – Adrian
    Commented Jul 11, 2017 at 20:01
  • Yes (in my case), reporting could be separeted from monitoring data; the reason, for not doing this, is that our system is not that complex, and adding an additional reporting application, would result in a much more complex infrastructure to manage. However, I like the idea to monitor the cost of the system, thank you (updated my question with this information).
    – krisy
    Commented Jul 12, 2017 at 6:16
2

For any given node, there are 4 basic resources with the following items to monitor:

  • CPU
    • Total
    • Per-core
  • Storage
    • Free space
    • Free inodes
    • Throughput
    • Backups
  • Memory
    • Free
    • Swap
    • Buffers
    • Cache
  • Network
    • Latency
    • Throughput
    • Jitter

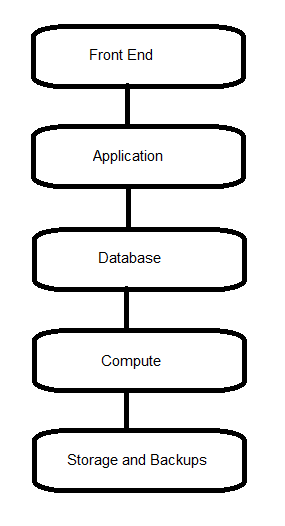
These four basic resources will power your application or service at every layer of your application. This will be architected into up to 5 layers depending on your environment and you will want to monitor them at every layer. This might look like:

Application Stack

This can change depending on how your environment is architected. For example, if you run all of your data off of NFS mounts, the Storage layer would sit beside compute instead of behind it. If you have a C++ based application that workstations connect to, you might not have a front-end layer. If your application uses flat files, you might not have a database layer. If you do not use virtual machines or containers and use local storage, you might not have a compute and storage layer. You will want to monitor the above 4 basic resources at every layer.

This represents the basic monitoring that can be given by your vendors, software and hardware. Covering these four basic resources at every layer should be your first goal. Once 100% coverage is achieved, You can additionally build hooks into your application to report additional health statuses, but by their nature, these will typically be built as a reaction to outages and you would have to work with your internal developers to build these kinds of hooks.

Monitoring these 4 basic resources should catch probably 80% of issues that cause outages however, and then you can start working on the remaining 20%.

4
  • If you're using auto-scaling, all of the listed metrics are useless for monitoring in the majority of cases on a per-instance basis. I don't care what the CPU usage of any one instance is, because if load is high enough, instances will be added, and if it's low enough, instances will be terminated. Monitoring is very situational.
    – Adrian
    Commented Jul 11, 2017 at 19:31
  • You should care - it makes a better product and customer experience. If you don't monitor each specific instance in the cluster, how do you know if a single node is unhealthy? How you prevent a partial outage and customer impact if a single node is acting up, but the average between two nodes hides the issue? How can you even decide what your average is in order to enlarge or shrink the cluster without monitoring each instance? Commented Jul 11, 2017 at 19:44
  • If a single node is acting up, it should be automatically terminated and replaced, so I don't need to know about it. Monitoring instance-level metrics for auto-scaling is done by the scaling controller, not by the IT monitoring system.
    – Adrian
    Commented Jul 11, 2017 at 19:52
  • Thank you; yes, this data if vital - but I do not feel it is enough/complete (it covers the hardware data layer I mentioned in the question)
    – krisy
    Commented Jul 12, 2017 at 6:10

Your Answer

By clicking “Post Your Answer”, you agree to our terms of service and acknowledge you have read our privacy policy.

Not the answer you're looking for? Browse other questions tagged or ask your own question.