I'm facing a discrepancy in memory usage reporting in my Kubernetes cluster, and I'm hoping to gain some insights into what might be causing it.
When I run kubectl top pods --all-namespaces, I get the following output listing memory usage for various pods in the cluster:
NAMESPACE           NAME                                                CPU(cores)   MEMORY(bytes)
argocd              argocd-application-controller-0                     40m          185Mi
argocd              argocd-applicationset-controller-584f68b9d7-l954j   1m           51Mi
argocd              argocd-dex-server-8577d9498b-l9lnv                  1m           17Mi
argocd              argocd-notifications-controller-564dcb4995-j582k    1m           25Mi
argocd              argocd-redis-66d9777b78-29mq6                       3m           4Mi
argocd              argocd-repo-server-58c94b5cbf-477v8                 1m           71Mi
argocd              argocd-server-b8bd4f4b5-kz4qw                       1m           41Mi
cert-manager        cert-manager-5b54fc556f-jjsqb                       1m           22Mi
cert-manager        cert-manager-cainjector-7d8b6cf7b9-885vx            1m           26Mi
cert-manager        cert-manager-webhook-7d4744b5ff-cmk98               1m           9Mi
gitlab              gitlab-deployment-66dcd84ffb-b58cs                  133m         6505Mi
kube-system         coredns-6799fbcd5-q7pns                             11m          17Mi
kube-system         local-path-provisioner-84db5d44d9-2466v             1m           7Mi
kube-system         metrics-server-67c658944b-44f5n                     12m          19Mi
kube-system         svclb-traefik-c1466e35-j2psx                        0m           2Mi
kube-system         traefik-5ff9bf948b-bh2bp                            1m           34Mi
linkerd             linkerd-destination-7b5d9869c8-69jwx                8m           63Mi
linkerd             linkerd-identity-7cfd498f58-jpdtr                   3m           24Mi
linkerd             linkerd-proxy-injector-f6c775c9c-wj9cj              3m           27Mi
linkerd-viz         grafana-5646d97bff-n7bj4                            14m          93Mi
linkerd-viz         metrics-api-5f5789c8cf-5mpzp                        2m           29Mi
linkerd-viz         prometheus-6c96bcf74d-85cs9                         25m          154Mi
linkerd-viz         tap-d94cf7688-np8sk                                 5m           29Mi
linkerd-viz         tap-injector-7c5b57889c-h8ft5                       2m           23Mi
linkerd-viz         web-69bbf5b8db-tz9t2                                5m           26Mi
microservice-demo   auth-service-deployment-69dc69b858-7zfl6            7m           543Mi
microservice-demo   backend-api-deployment-786b954f-7kbg4               18m          99Mi
microservice-demo   mongodb-deployment-7d94b89cf5-xs5gs                 12m          288Mi
microservice-demo   payout-service-deployment-7fdf698f68-78zzx          7m           79Mi
microservice-demo   wallet-service-deployment-687fc74bdb-hlh4w          11m          86Mi
microservice-demo   web-app-deployment-5dc5dcbf7c-lz9q8                 1m           7Mi
microservice-demo   wheel-service-deployment-5bfb59d776-nr4pf           4m           67Mi
Summing up the memory usage of these pods, the total comes to approximately 9146Mi.
However, when I check the memory usage of the node using kubectl top, it reports a much higher memory usage:
NAME      CPU(cores)   CPU%   MEMORY(bytes)   MEMORY%
myserver  785m         9%     16508Mi         51%
As you can see, the memory usage reported for the node (16508Mi) is significantly higher than the sum of memory usage of the listed pods (9146Mi).
I have verified that the output of kubectl top pods --all-namespaces includes all pods running on the node, so I'm puzzled as to what might be consuming the additional memory reported for the node.
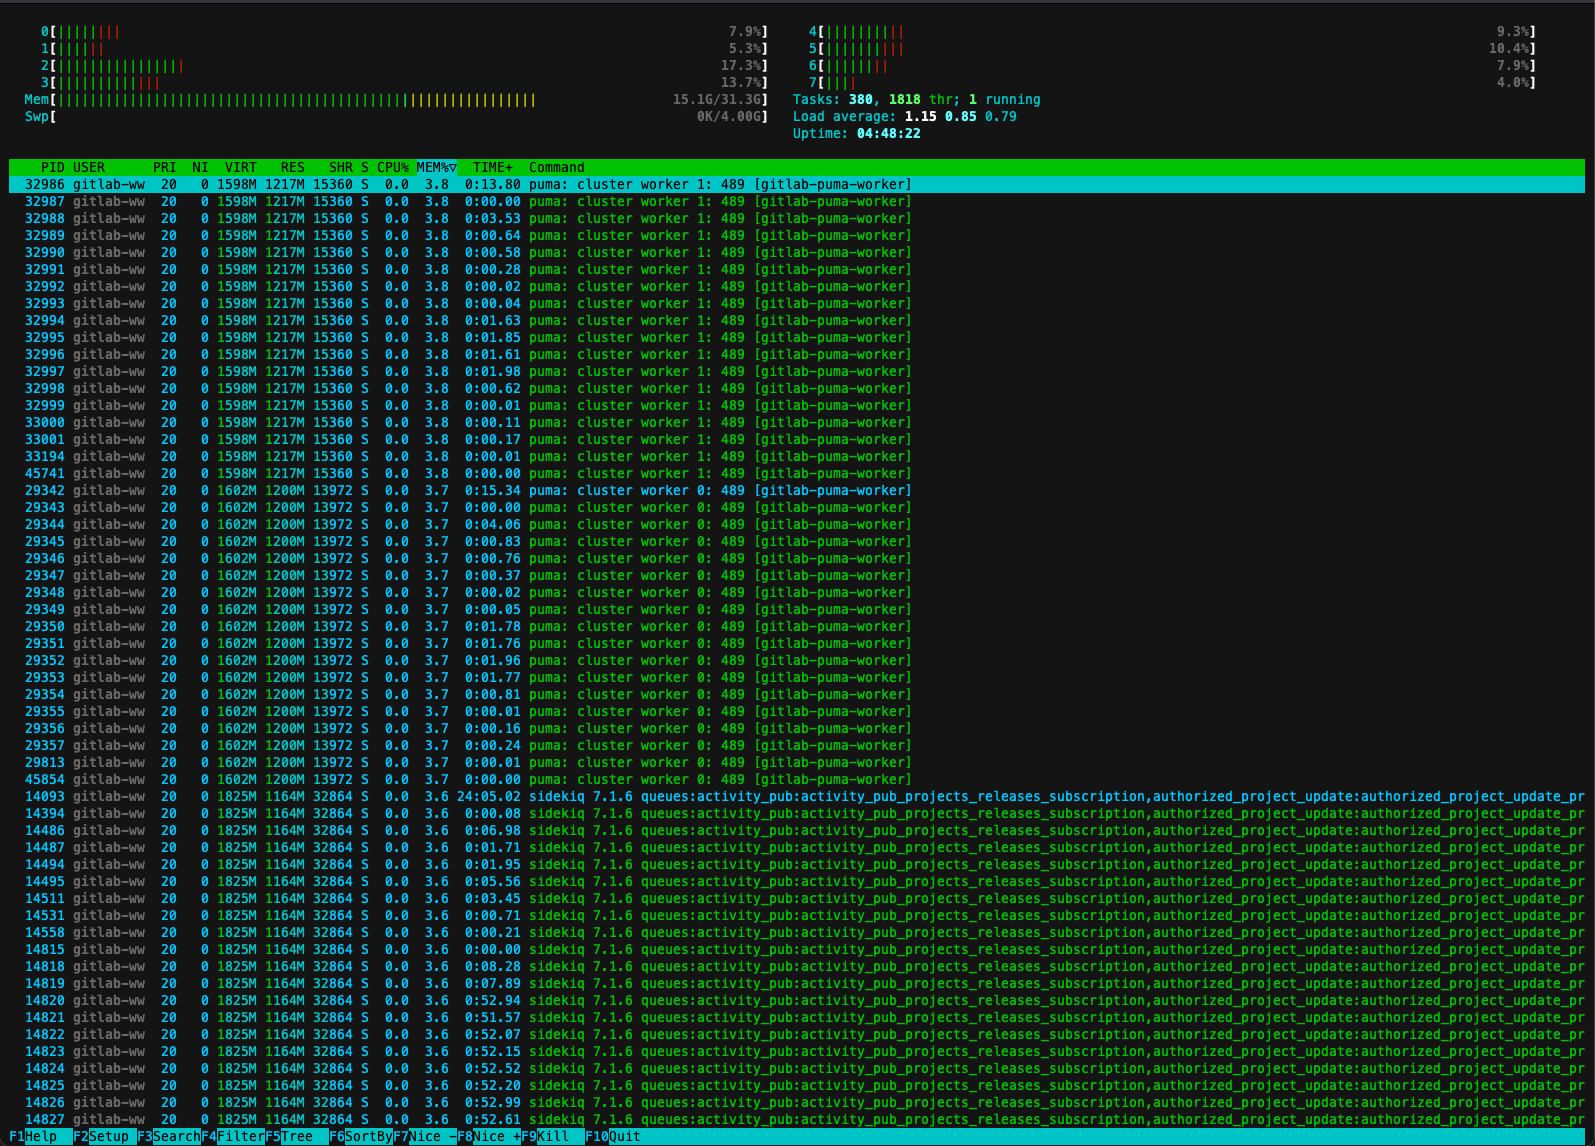
Using htop I also don't get any additional information, except the running pods, because htop tells me that GitLab is the one that is using the most:

Could anyone provide insights into why there might be such a discrepancy? What other factors or components could be contributing to the memory usage reported for the node and how I can decrease it. It feels like the whole k3s thing is using way too much memory in total for the clusters that I run. I see people running GitLab on raspberry pi's and stuff, so why is 16GB of RAM not enough?