15

AWS Lambda cost is dependent on the time a function runs, and to some extent on memory footprint. Having functions that finish faster, and take up less memory can save quite a lot of money. Especially when such a function is executed often.

How can a Node.js Lambda function be tuned for speed and small memory footprint to save on cost?

Are there other aspects for Lambda that are advantageous to improve?

4 Answers 4

7

Dawny33 response is good, but I would start earlier in the development process.

Keeping an eye on your cloud environment to make sure that your functions behaves as you expect (including your "production" functions, which might operate on a different data set) is crucial, because it might reveal things that are impossible to reproduce locally or with a test data-set.

Nonetheless, I would say that this performance testing that you do in an optimization purpose should start straight from the developer's machine. Or, at least, from some local environment before pushing to the cloud.

The reason I say so is that while AWS Lambdas are amazing on many points, the fact that you don't have a full control on the server will limit your instrumentation abilities. I'm not saying instrumentation is impossible when in serverless, but try figuring out how many CPU interrupts you have (and how many are caused by your code) just for fun ;)

So what I advise, and this is actually not limited to serverless, is to start the profiling early. NodeJS profiling can be made with many different tools, NewRelic, dynatrace and AppDynamic are some of the big players. There is also smaller player, some of them are just a NPM package to install (like Nodefly). It is also possible to do some NodeJS without any additional tool, as there is a profiler built into the V8 engine. This documentation from NodeJS will get you started.

Whatever tool you choose, you want to install it locally and collect profiling data. That might involve running an agent or including a package in your package.json. Your tool's instructions will tell you how to install it. A good profiler will let you know how much memory and CPU you use. Better tools will give you insight on how many remote calls were made, how long they took.

Use the profiling data that the tool gives you to identify bottlenecks and address them. There's no limit on how much profiling you can make. Some people (crazy?) will look at the system calls of their most critical function. You might have to do that kind of thing if you want to shave nanoseconds of your function (but then, maybe AWS Lambda isn't the best choice to start with).

It's also worth noting at this point that I haven't mentioned anything specific to AWS Lambda. That's because your optimizations will most likely not be AWS Lambda specific (after all, in serverless you shouldn't be worried about the server/environment).

Make sure that not only your code works, but that it works the way you expect it to. Don't over optimize, but keep a critical eye on CPU and memory usage. Should a 2MB array really grow to 10MB when you sort it? Probably not.

Then you will be able to use tools mentioned by Dawny33, or some other tools, to confirm that your functions perform similarly when deployed to Lambda. You will however already have a very high level of confidence in your function and will only need to validate that they behave properly, not fully profile them.
4
  • Yes, it is important, but how can it be done? Are there some tools, practices, what exactly can a developer do? I don't see any of this mentioned in this answer :/ Commented Mar 3, 2017 at 4:00
  • I said so, through profiling and instrumentation. NewRelic APM is an example, but that's just one of the profilers available. Install the profiler, run your function, optimize. Whether it will run on AWS Lambda doesn't matter, unless you have a problem specific to AWS. I will update my answer based on your comment.
    – Alexandre
    Commented Mar 3, 2017 at 4:09
  • Some examples and links to articles, blogs, known profilers that can do the job. That is the kind of thing that imho makes the answer valuable, not just sending people to ask a question somewhere "how do I count my cpu interrupts, I have no clue". Commented Mar 3, 2017 at 4:11
  • Good point. I have improved my answer again.
    – Alexandre
    Commented Mar 3, 2017 at 4:23
5

I might not be able to answer it completely, but here are my views from my limited experience with lambda:

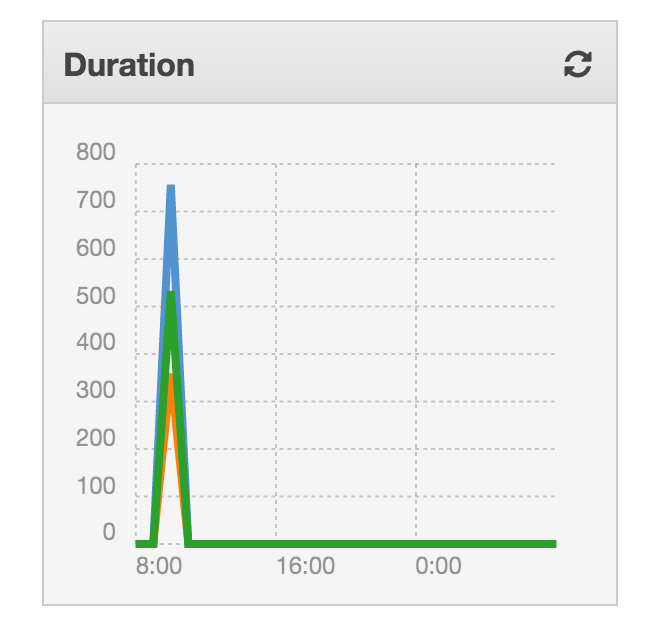
  1. Speed-Performance: The duration of a single run of a lambda function will be present in the dashboard of the Lambda's monitoring tab, which looks something like this:

enter image description here

So do throttles/errors/number of invocations.

  1. One can also set up CloudWatch filters for the memory usage of a lambda function, whose data can be used to further optimize your handler. This is a decent post on how to set one up.
  2. Also, set up proper logging, so that you can later go through the logs in CloudWatch. This isn't an optimization hack per se, but more of a best practise
  3. Testing: Test your lambda functions thoroughly, so that you don't miss out on edge cases. This is important, as lambda retries failed functions before giving up. So, you can save up on time forehand if you tested the function properly. Guide to testing Lambda functions
5

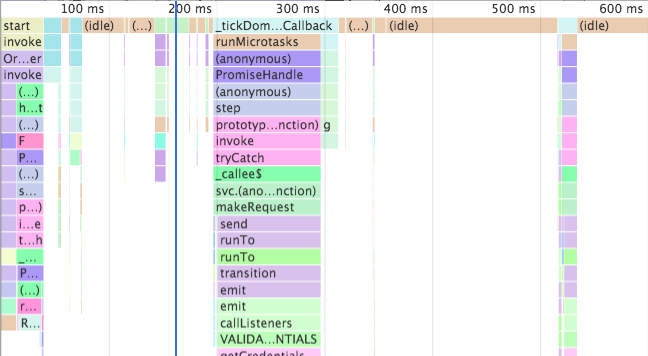
Check out the IOpipe profiler to get full v8 profiler dumps from Lambda invocations. You can load those into Chrome Devtools to see exactly where CPU time is spent, and how memory is being used for your functions.

enter image description here

Disclaimer: I work for IOpipe

0

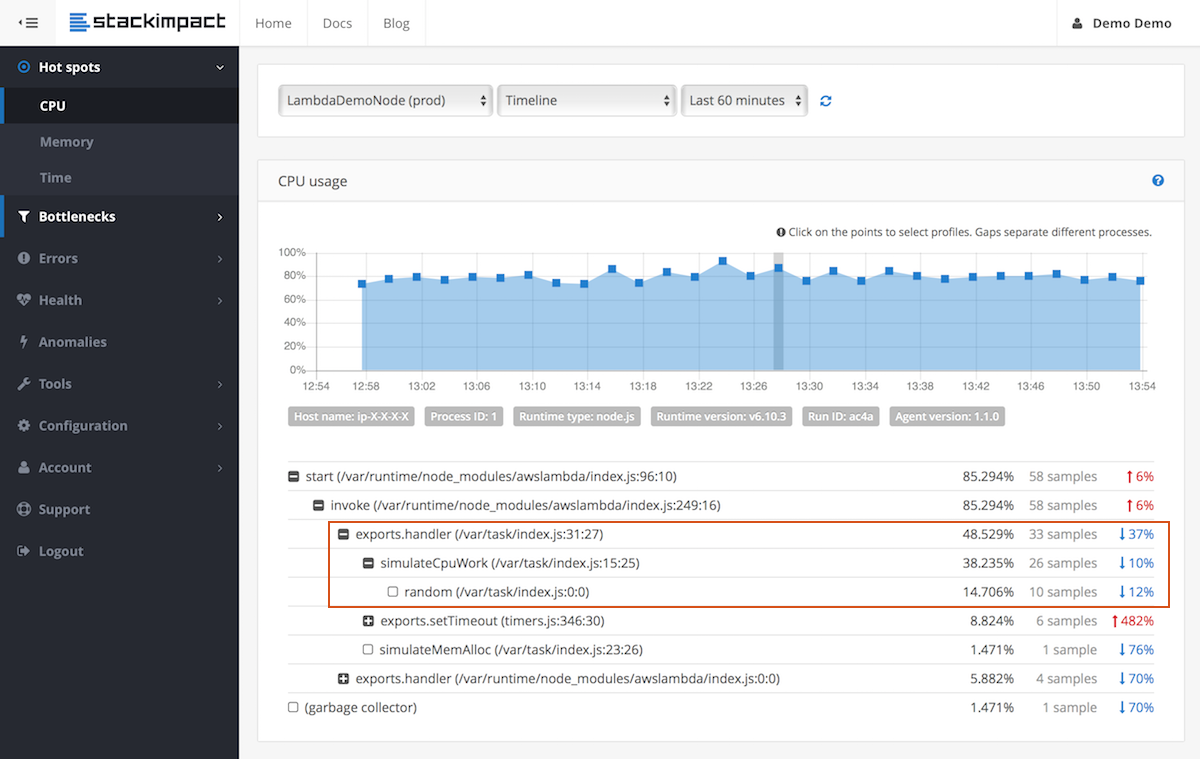
Use StackImpact agent to get CPU and memory profiles. More details in the blog post: AWS Lambda CPU and Memory Profiling (Node.js). Because Lambda Node.js process is freezing between requests, most of the other tools will probably not work out of the box.

enter image description here

Disclaimer: I work for StackImpact

1
  • While it sounds related and potentially a valid solution, extending a little on how it may help addressing the question would avoid the feeling of a link only answer where if the link rot there's not much to get a first idea on how it may help.
    – Tensibai
    Commented Oct 20, 2017 at 9:17

Your Answer

By clicking “Post Your Answer”, you agree to our terms of service and acknowledge you have read our privacy policy.

Not the answer you're looking for? Browse other questions tagged or ask your own question.